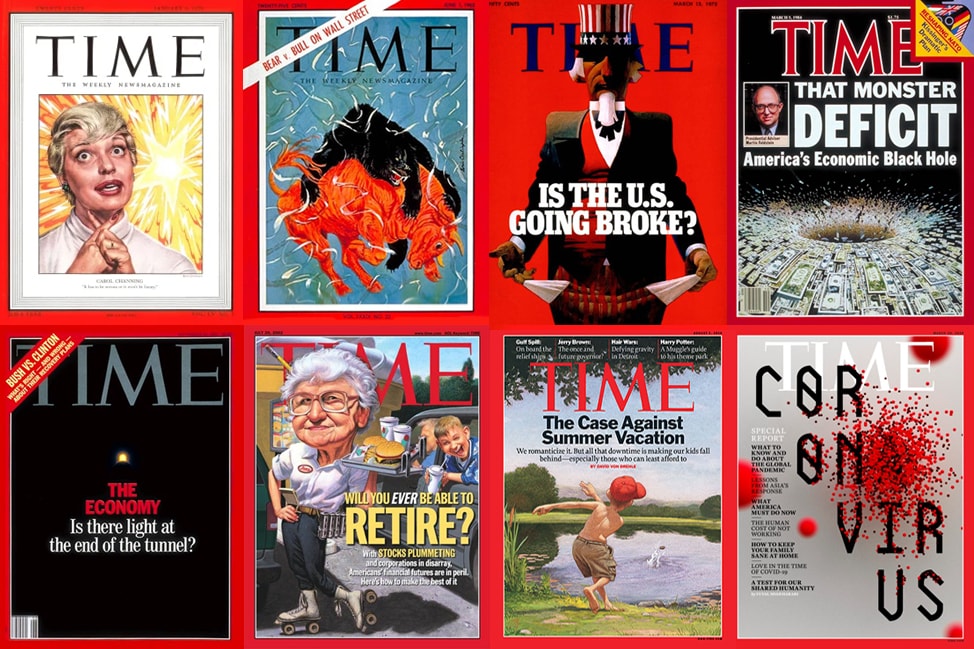
We should all have learned by now that bad news sells newspapers. Bad news gets clicks through to websites and then it sells advertising space. In fact, there’s nothing like a bit of fear to fuel media consumption and drive Google searches.
Meanwhile, the good news rarely gets noticed. If we were to believe the papers, then there’s no good news at all to be reported. Financial news is no different – stock market crashes are always front page news, but you have to hunt harder for the stories of recovery.
But isn’t there a story in the fact that the stock market is over a hundred times stronger now than it was 70 years ago? If you’d invested $10,000 back in 1950 and sat tight through all the ups and downs, your investment would now be worth $1,000,000. Amazing, right?
Looking Back Through Time
So, inspired by an article I saw recently, I wanted to show you these eight covers of Time magazine. Eight covers for seven decades. Eight covers for eight decades and eight seemingly dire economic outlooks.
The 1950s
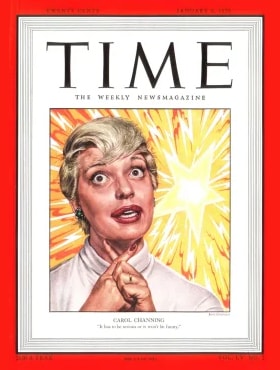
Date of publication: January 9, 1950
President: Harry S. Truman (Democrat)
Song at #1 in the Billboard Charts: Rudolph the Red-Nosed Reindeer by Gene Autry
S&P 500 stock index closed at: 17
Median house price: $7,354
This issue reported that the stock market had fallen so dramatically that $3.5 billion had been wiped out in three months, and it was at its lowest point since the end of World War 2. Unemployment was as high as it had been during the war, and politicians were announcing the arrival of a new depression.
The 1960s
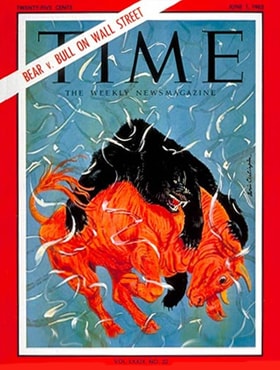
Date of publication: June 1, 1962
President: John F. Kennedy (Democrat)
Song at #1 in the Billboard Charts: Stranger on the Shore by Mr Acker Bilk
S&P 500 stock index closed at: 59
Median house price: $19,592
In the middle of 1962, the cover of Time showed the bull market getting clobbered by the bear. An optimistic time was being dampened – the magazine reported that the paper value of the stocks listed on the Big Board fell by $30 billion. Waves of selling were dragging the Dow-Jones index down, seemingly wiping off the progress of the previous 18 months. The magazine noted the “plummeting” of the value of stocks on the American Exchange as well.
The 1970s
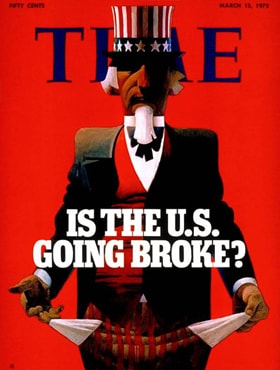
Date of publication: March 13, 1972
President: Richard Nixon (Republican)
Song at #1 in the Billboard Charts: Without You by Nilsson
S&P 500 stock index closed at: 107
Median house price: $27,400
More drama in 1972. The USA was “going broke.” According to this issue of Time, providing public services to all Americans was plunging the country into debt. Public spending was increasing the deficit between federal income and outgoings, and this was an enduring issue. The magazine said that in 1970, federal, state and local governments had spent $60 billion more than they had accumulated, and this gap was growing despite increases in tax.
The 1980s
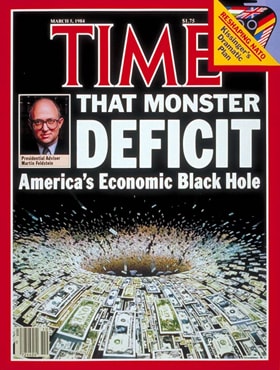
Date of publication: March 5, 1984
President: Ronald Reagan (Republican)
Song at #1 in the Billboard Charts: Jump by Van Halen
S&P 500 stock index closed at: 158
Median house price: $78,400
It’s that deficit again – this time it’s a monster AND it’s a black hole. The magazine said that inflation was imminent, interest rates could stagnate, and people wouldn’t want to invest. In other words, the previous and ongoing recovery was doomed. The magazine went so far as to say “…the future health of the US economy may slip irretrievably away.” Irretrievably! Well, there’s nothing like a bit of an overstatement and some apocalyptic predictions to sell a copy or two.
The 1990s
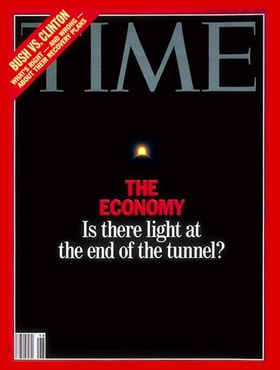
Date of publication: September 28, 1992
President: George H. W. Bush (Republican)
Song at #1 in the Billboard Charts: End of The Road by Boyz II Men
S&P 500 stock index closed at: 417
Median house price: $119,500
In 1992, Time Magazine reported that the current market slump was “the longest period of sustained weakness since the Great Depression.” America had, apparently, never before seen such “turbulent, epochal change, the sort of upheaval that happens once in 50 years.” 18 months following the official end of the previous recession, the recovery was being reported as slow, “about half the speed of a normal recovery.” The upcoming Bush/Clinton election was probably a catalyst for the media hysteria this time – the presidential game plan for financial recovery was center stage.
The 2000s
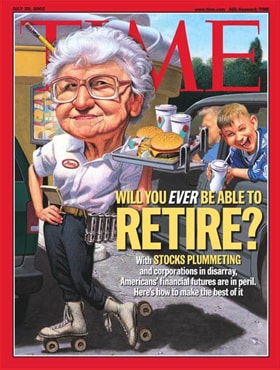
Date of publication: July 29, 2002
President: George W. Bush (Republican) (although actually, due to surgery he was having on this very day, he’d transferred his powers to his right hand man, so for a couple of hours, it was President Cheney)
Song at #1 in the Billboard Charts: Complicated by Avril Lavigne
S&P 500 stock index closed at: 899
Median house price: $175,600
Well, you’d better make sure you know how to skate because you’re going to be a waitress until your dying day, and you’ve got to stay competitive! Once again, the magazine reported plummeting stocks in huge, emphasised letters – $7.7 trillion had been incinerated and there was little optimism that this would ever be corrected. According to the magazine, your retirement savings might never, ever recover from this one.
The 2010s
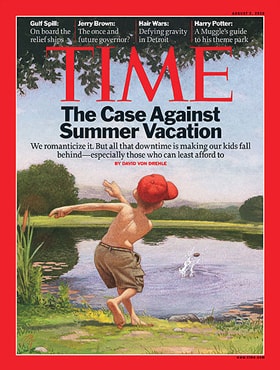
Date of publication: August 2, 2010
President: Barack Obama (Democrat)
Song at #1 in the Billboard Charts: Love the Way You Lie by Eminem ft. Rihanna
S&P 500 stock index closed at: 1126
Median house price: $226,600
The cover said you really should reconsider whether having time off over the summer is really time well spent, and linked that to kids’ economic status. Work! Especially if you’re poorer – work harder! Globally, stock markets were taking a tumble, losing 10% over a few weeks. The most recent economic recovery was failing, just a year in. European countries like Greece were struggling, and the magazine said worry about that as well as high unemployment nationally was going to stunt economic growth. Concern was going to develop into fear.
The 2020s

Date of publication: March 30, 2020
President: Donald Trump (Republican)
Song at #1 in the Billboard Charts: The Box by Roddy Ricch
S&P 500 stock index closed at: 2409
Median house price: $320,000
Another decade, another recession looms. This time, the pandemic prompted immediate stock market crashes. The magazine said that US stocks had plunged the most since 1987 and the Russell 2000 had its worst day on record, ever. With the closing down of the economy as businesses were shut and people asked to stay home, finance professionals were at a loss. They’d never experienced an enforced shutdown like this – what would it mean for the economy?
Stock Market Crashes are Inevitable
I’ve touched on this subject before, but it really does keep coming around again. These seven snapshots into media history show us that the stock market crashes periodically, and its recovery is sometimes slow and wavering.
The market will dip and the history has shown us repeatedly that the market will rise again. Historically, we’ve seen nothing but a sustained, upward trend. And if that changes and the public equity markets quit being a mechanism of wealth creation – well then, we’ve got bigger problems than the value of our account statements.
And while I know there are many who love nothing more than relaxing with a magazine from time to time, it’s important to take these headlines with a pinch of salt. Don’t forget, CNN reported in June 2020 that the S&P 500 had just experienced its strongest 50-day period ever. Since its low point in March, the S&P 500 has grown by an unprecedented 36.9%.
In the meantime, I’m an eternal optimist and these headlines from the past are a great reminder that we’ve been here before, and we’ll probably be here again. So keep yourself well informed and get the full picture. Read, listen, and question widely.
Instead of being fearful about stock market crashes, remember that they happen periodically. Using these images as a bit of reassurance, consider how the stock markets crashes have worked out in the past.
If you’d like to chat more about your finances and their resilience through stock market crashes, schedule an appointment with us today. We’ll be delighted to see if we can create a more robust financial plan for you.


